Do Founder-Led Stocks Outperform?
I created a founder index to test this hypothesis and compare it to the broader market.
Not financial advice. Do your own research. Past performance doesn't guarantee future results.
It's common advice in early-stage investing that the founder is the most important factor. This made me wonder—does the same principle apply to public companies?
Thesis: Founder-led companies have a disproportionate advantage.
Why?
This perspective comes from my own limited experience as a founder and observations of many founder friends. It’s also influenced by Paul Graham’s essay, “Founder Mode.”
I could not imagine anyone running Scale AI with more aggression than Alexandr Wang. I could not imagine anyone running Airbnb with more obsession than Brian Chesky. These companies are successful because of their respective founder qualities.
Simply put, it comes down to two things:
- Passion. Founders often view their company as their child. This deep attachment isn't something a salary or title can provide; it's forged through years of highs and crushing lows, almost like a romantic relationship.
- Vision. Founders have a greater mission and curiosity they want to chase. Take Mark Zuckerberg, for example. He steered Meta into AR/VR despite initial skepticism and positioned the company as an AI leader. Although these moves may have little connection to Meta’s core business, in 2024 they became huge trends. Hired executives will face greater challenges when pivoting a company, whereas founders tend to maintain a stronger grip on the steering wheel.
While I acknowledge that some founders have mismanaged their companies or become less effective as their organizations expanded—the evidence being the existence of private equity—I still believe that most companies thrive under founder leadership.
Building an Index
To test this thesis, I scraped the New York Stock Exchange (NYSE) to build a stock index.[^1] I include a company in my index if it meets the following conditions:
- The current CEO must be the founder/co-founder of the company.
- The market cap is greater than 1B.
In the future, I want to experiment with more sophisticated triggers, but let’s start simple. The above index is composed of 296 companies.
The complete index can be found here.
Benchmarking Against SPY
Are we onto something? I compared the index’s returns against the S&P 500 (SPY). To ensure a fair comparison, I market-cap weighted the index to mirror the SPY's methodology.
(@substack please add tables!)
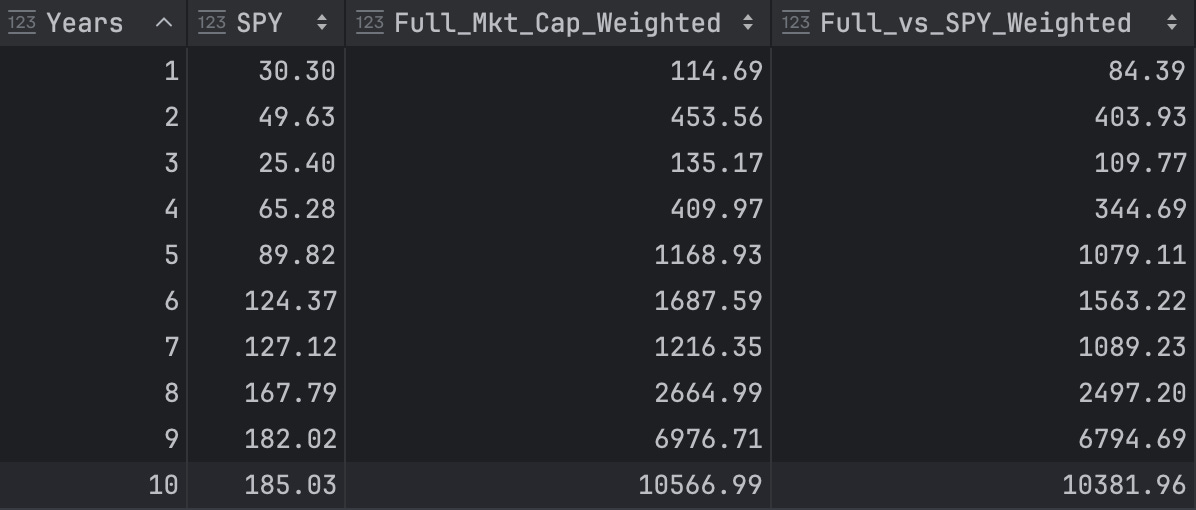
The initial results looked promising, but I needed to account for a significant confounding factor: NVIDIA (NVDA) comprised 35% of the weighted portfolio as the largest holding. To understand the true performance, I conducted a second analysis with NVDA removed.
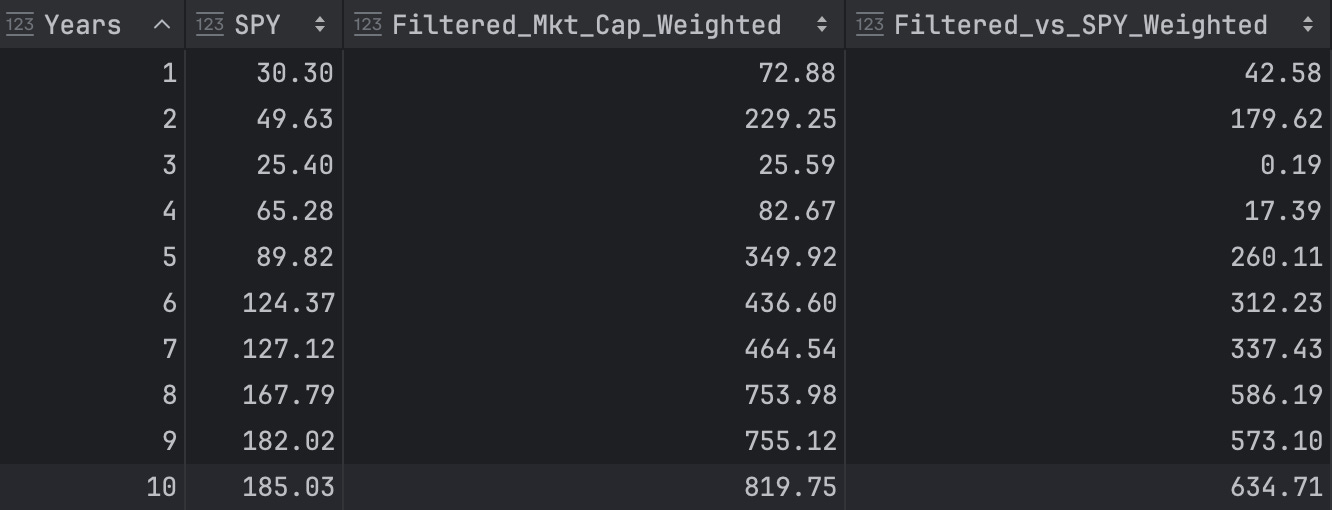
This adjustment revealed NVDA's outsized influence on the index's performance. However, the most compelling finding remained: even without NVDA, the index consistently outperformed the SPY across all time horizons.[^2] This suggests the underlying strength of the selection criteria extends beyond a single high-performing stock.
Conclusion: Over a 10-year time horizon, the founder index would beat the SPY by 10,566.99% with an annualized return of 59.52% vs the SPY’s 11.04%.[^3]
A complete table can be found here.
Index Composition
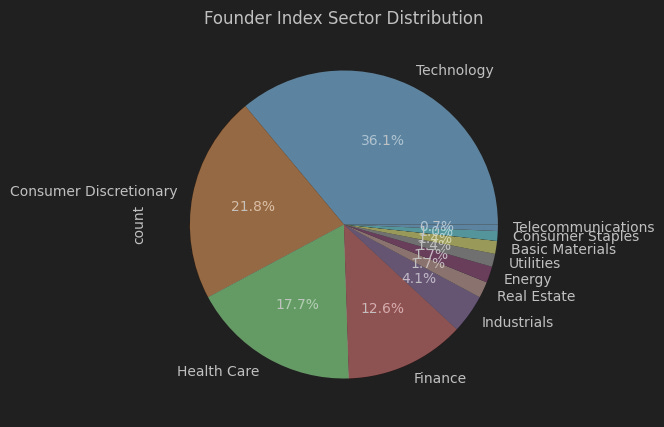
By Sector
Most companies in the founder index are technology firms, followed by those in the consumer and healthcare sectors. It’s interesting to note that these are among the most popular sectors for venture backing—suggesting a large portion of the index is made up of venture-backed companies. With American Dynamism emerging as a hot investment vertical, I would expect to see more government, energy, and defense companies going public in the coming years (and joining the founder index).
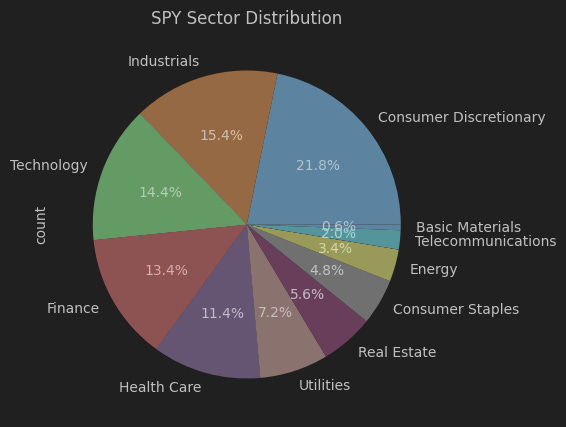
For reference, here is the sector distribution of the SPY:
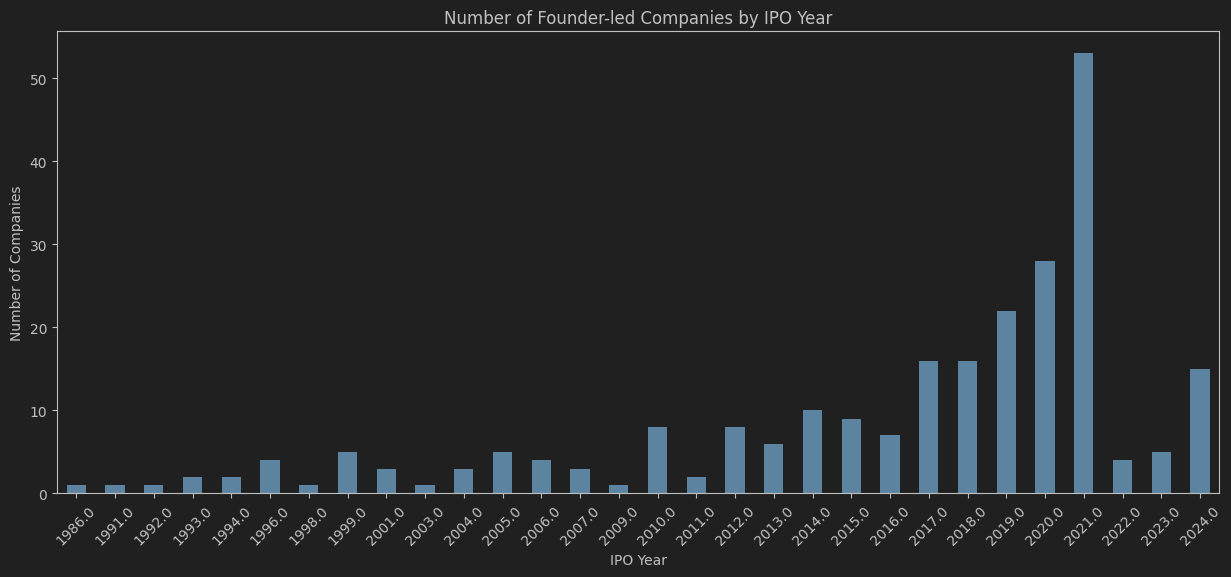
By IPO Year
The number of founder-led companies has subtly increased every year.[^4] 2021 was a record year for IPOs due to ZIRP, which is reflected in the founder index. However, I wouldn’t consider this an outlier as evidence of an accelerated growth rate.
By Market Cap
The initial index has 296 companies with the following distribution based on market cap (with a 1B floor):
# index distribution based on market cap (1B floor)
count     296.000000
mean       34.575357
std       235.198755
min         1.024893
25%         2.069473
50%         4.194686
75%        13.215535
max      3621.363900
I noticed half the companies had a market cap below 5B and wanted to more intentionally filter out smaller companies/penny stocks. I created a second index (133 companies) with a higher market cap floor of 5B, resulting in the following distribution:
# index distribution based on market cap (5B floor)
count     133.000000
mean       73.962085
std       347.546234
min         5.093807
25%         8.130798
50%        15.250003
75%        34.386152
max      3621.363900
This change did not make a meaningful difference in the annualized returns. Over 10 years, the annualized return is slightly higher at 60.14% versus 59.52%.
A complete list of stocks in the large cap index can be found here, with a breakdown of the returns here.
Follow-ups
- What if the founder is not the CEO but on the board? (e.g., chairman, president, CTO, CFO, etc.)
- Can you judge a company based on college graduate demand? For instance, if I took the most desired internships for college students at a top-20 school, how would that index perform? The theory is that companies with the best talent should win.
All results can be found here. I plan to post a Jupyter notebook to replicate the above analysis once I finish cleaning up the code.
[^1]: The index is based on a snapshot taken on November 20, 2024.
[^2]: The index was notably closer to the SPY during the Covid-19 pandemic, suggesting it was influenced by the same market forces and investor sentiment during that period.
[^3]: If NVDA were excluded, the founder index would beat the SPY by 634.71% with an annualized return of 24.84% versus the SPY’s 11.04%.
[^4]: This distribution is likely biased by the requirement that the founder must be CEO today. For example, OPEN (Opendoor) would not appear on this chart since Eric Wu is not CEO today (although he was CEO when it went public in 2020).